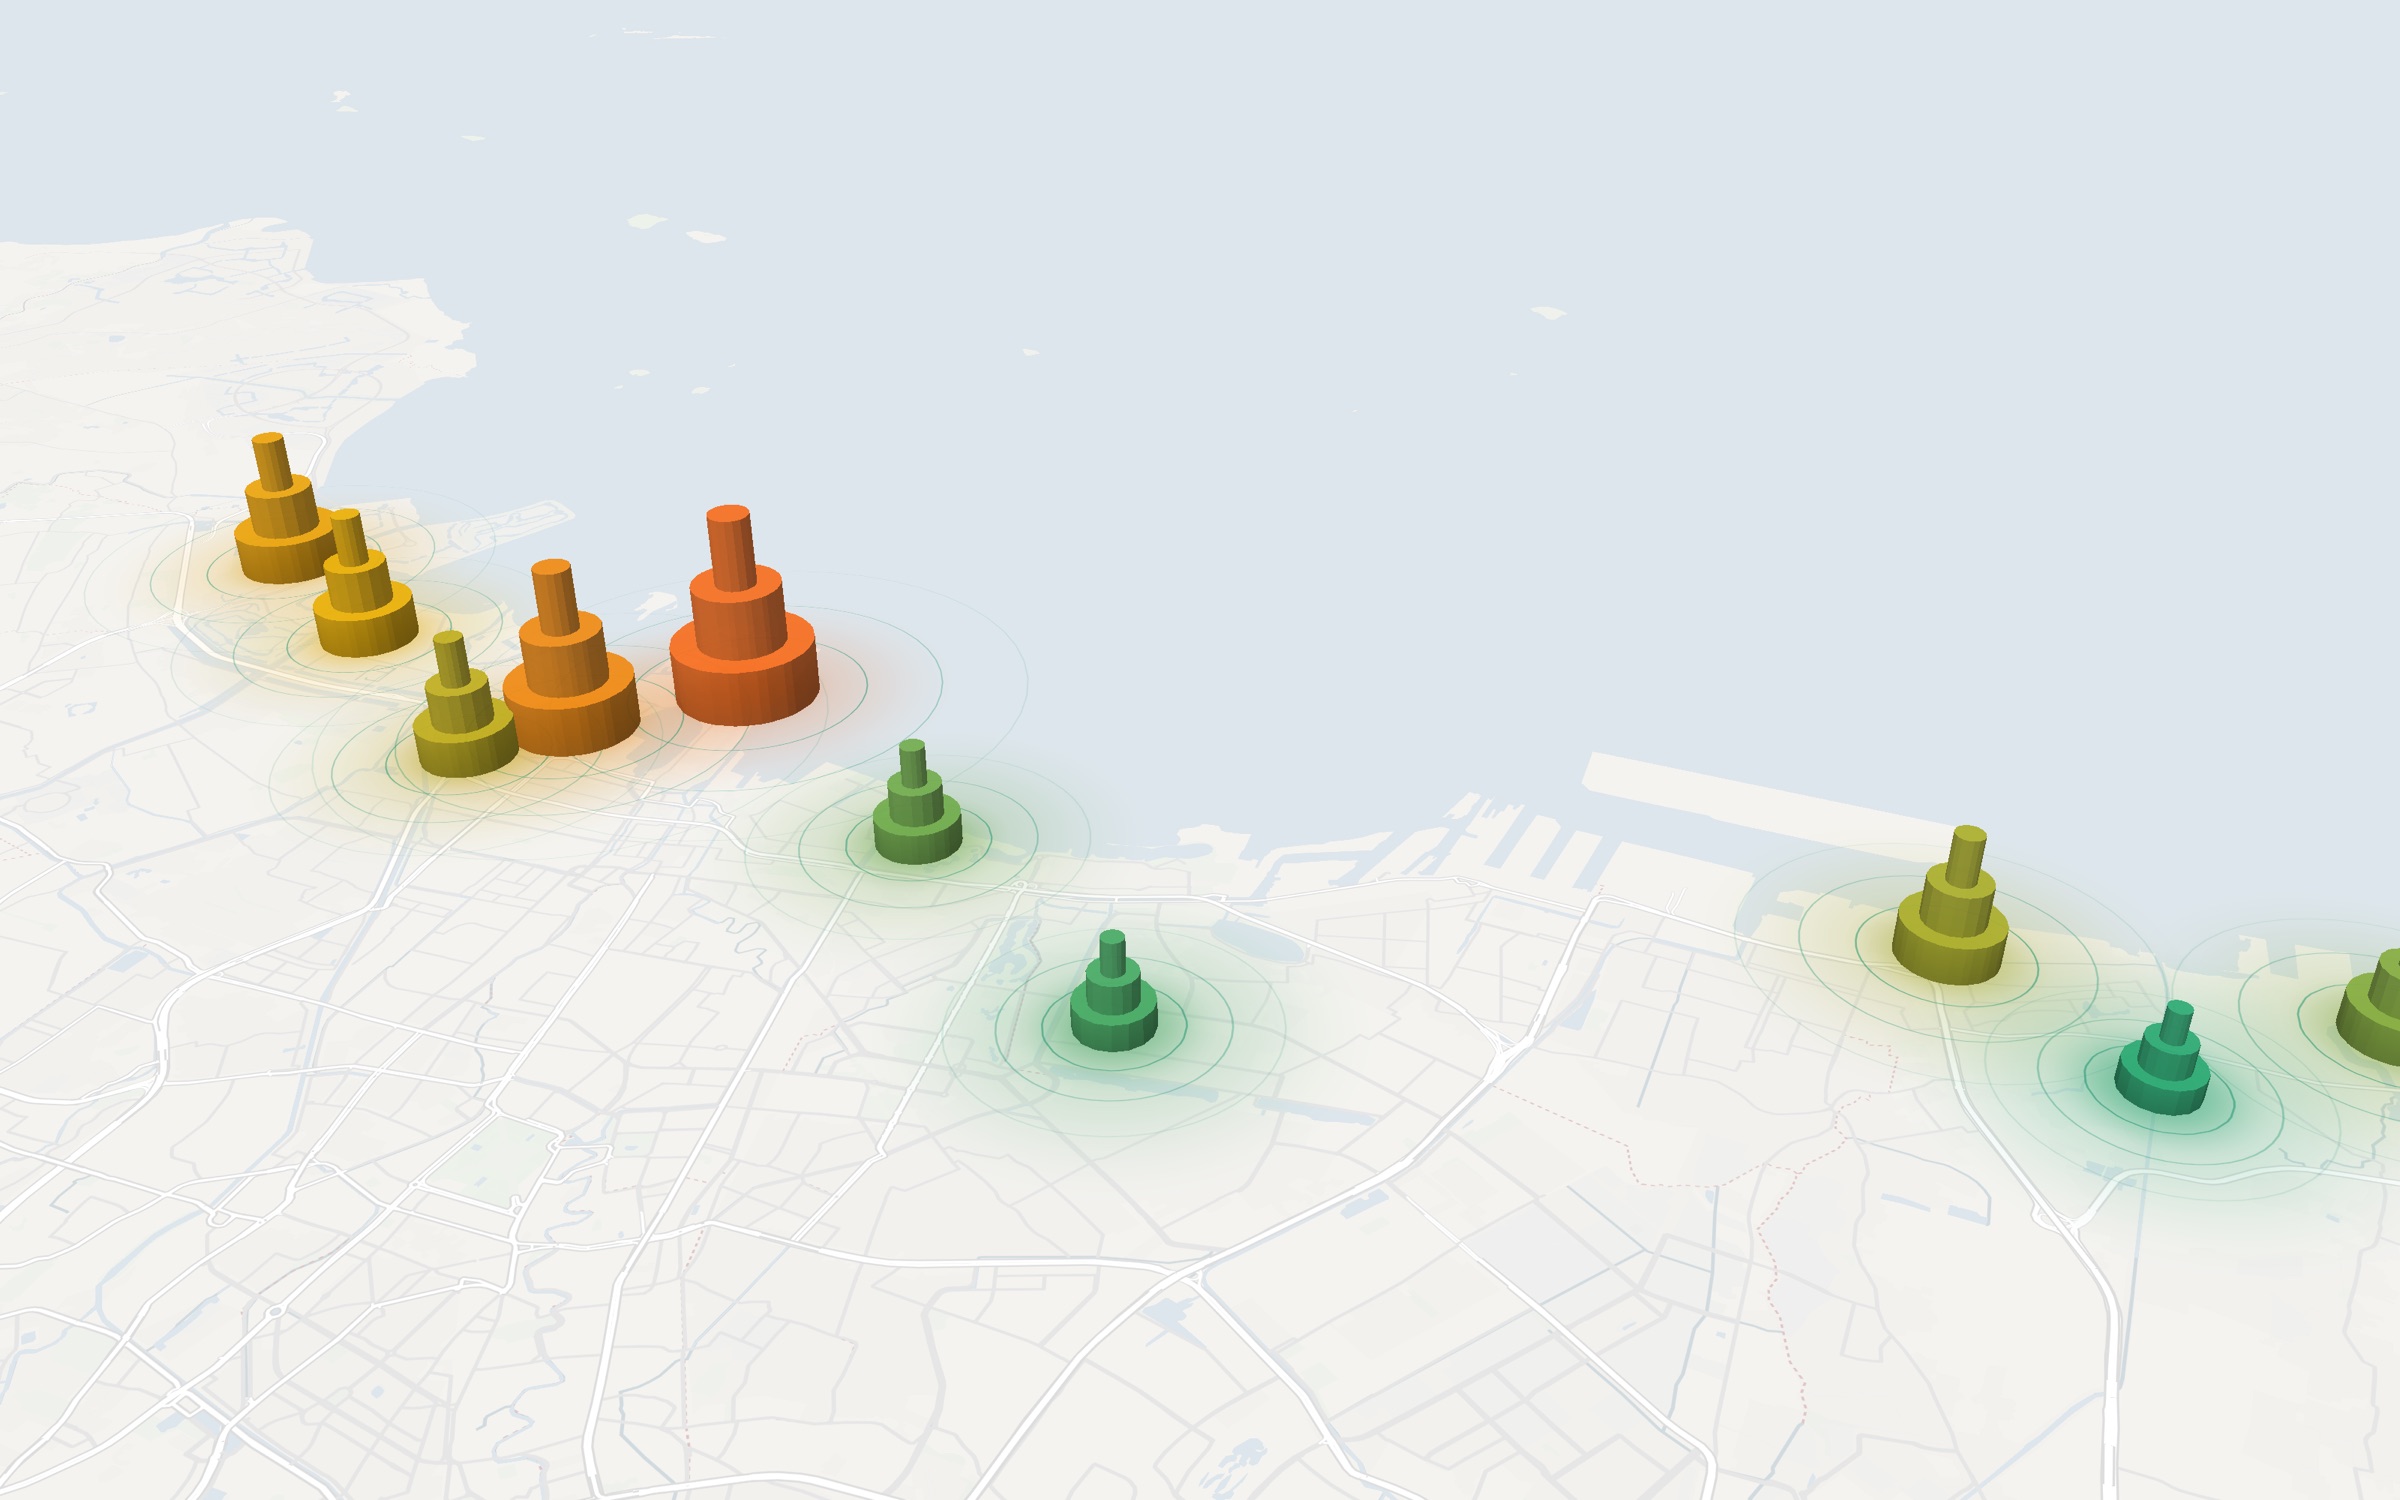
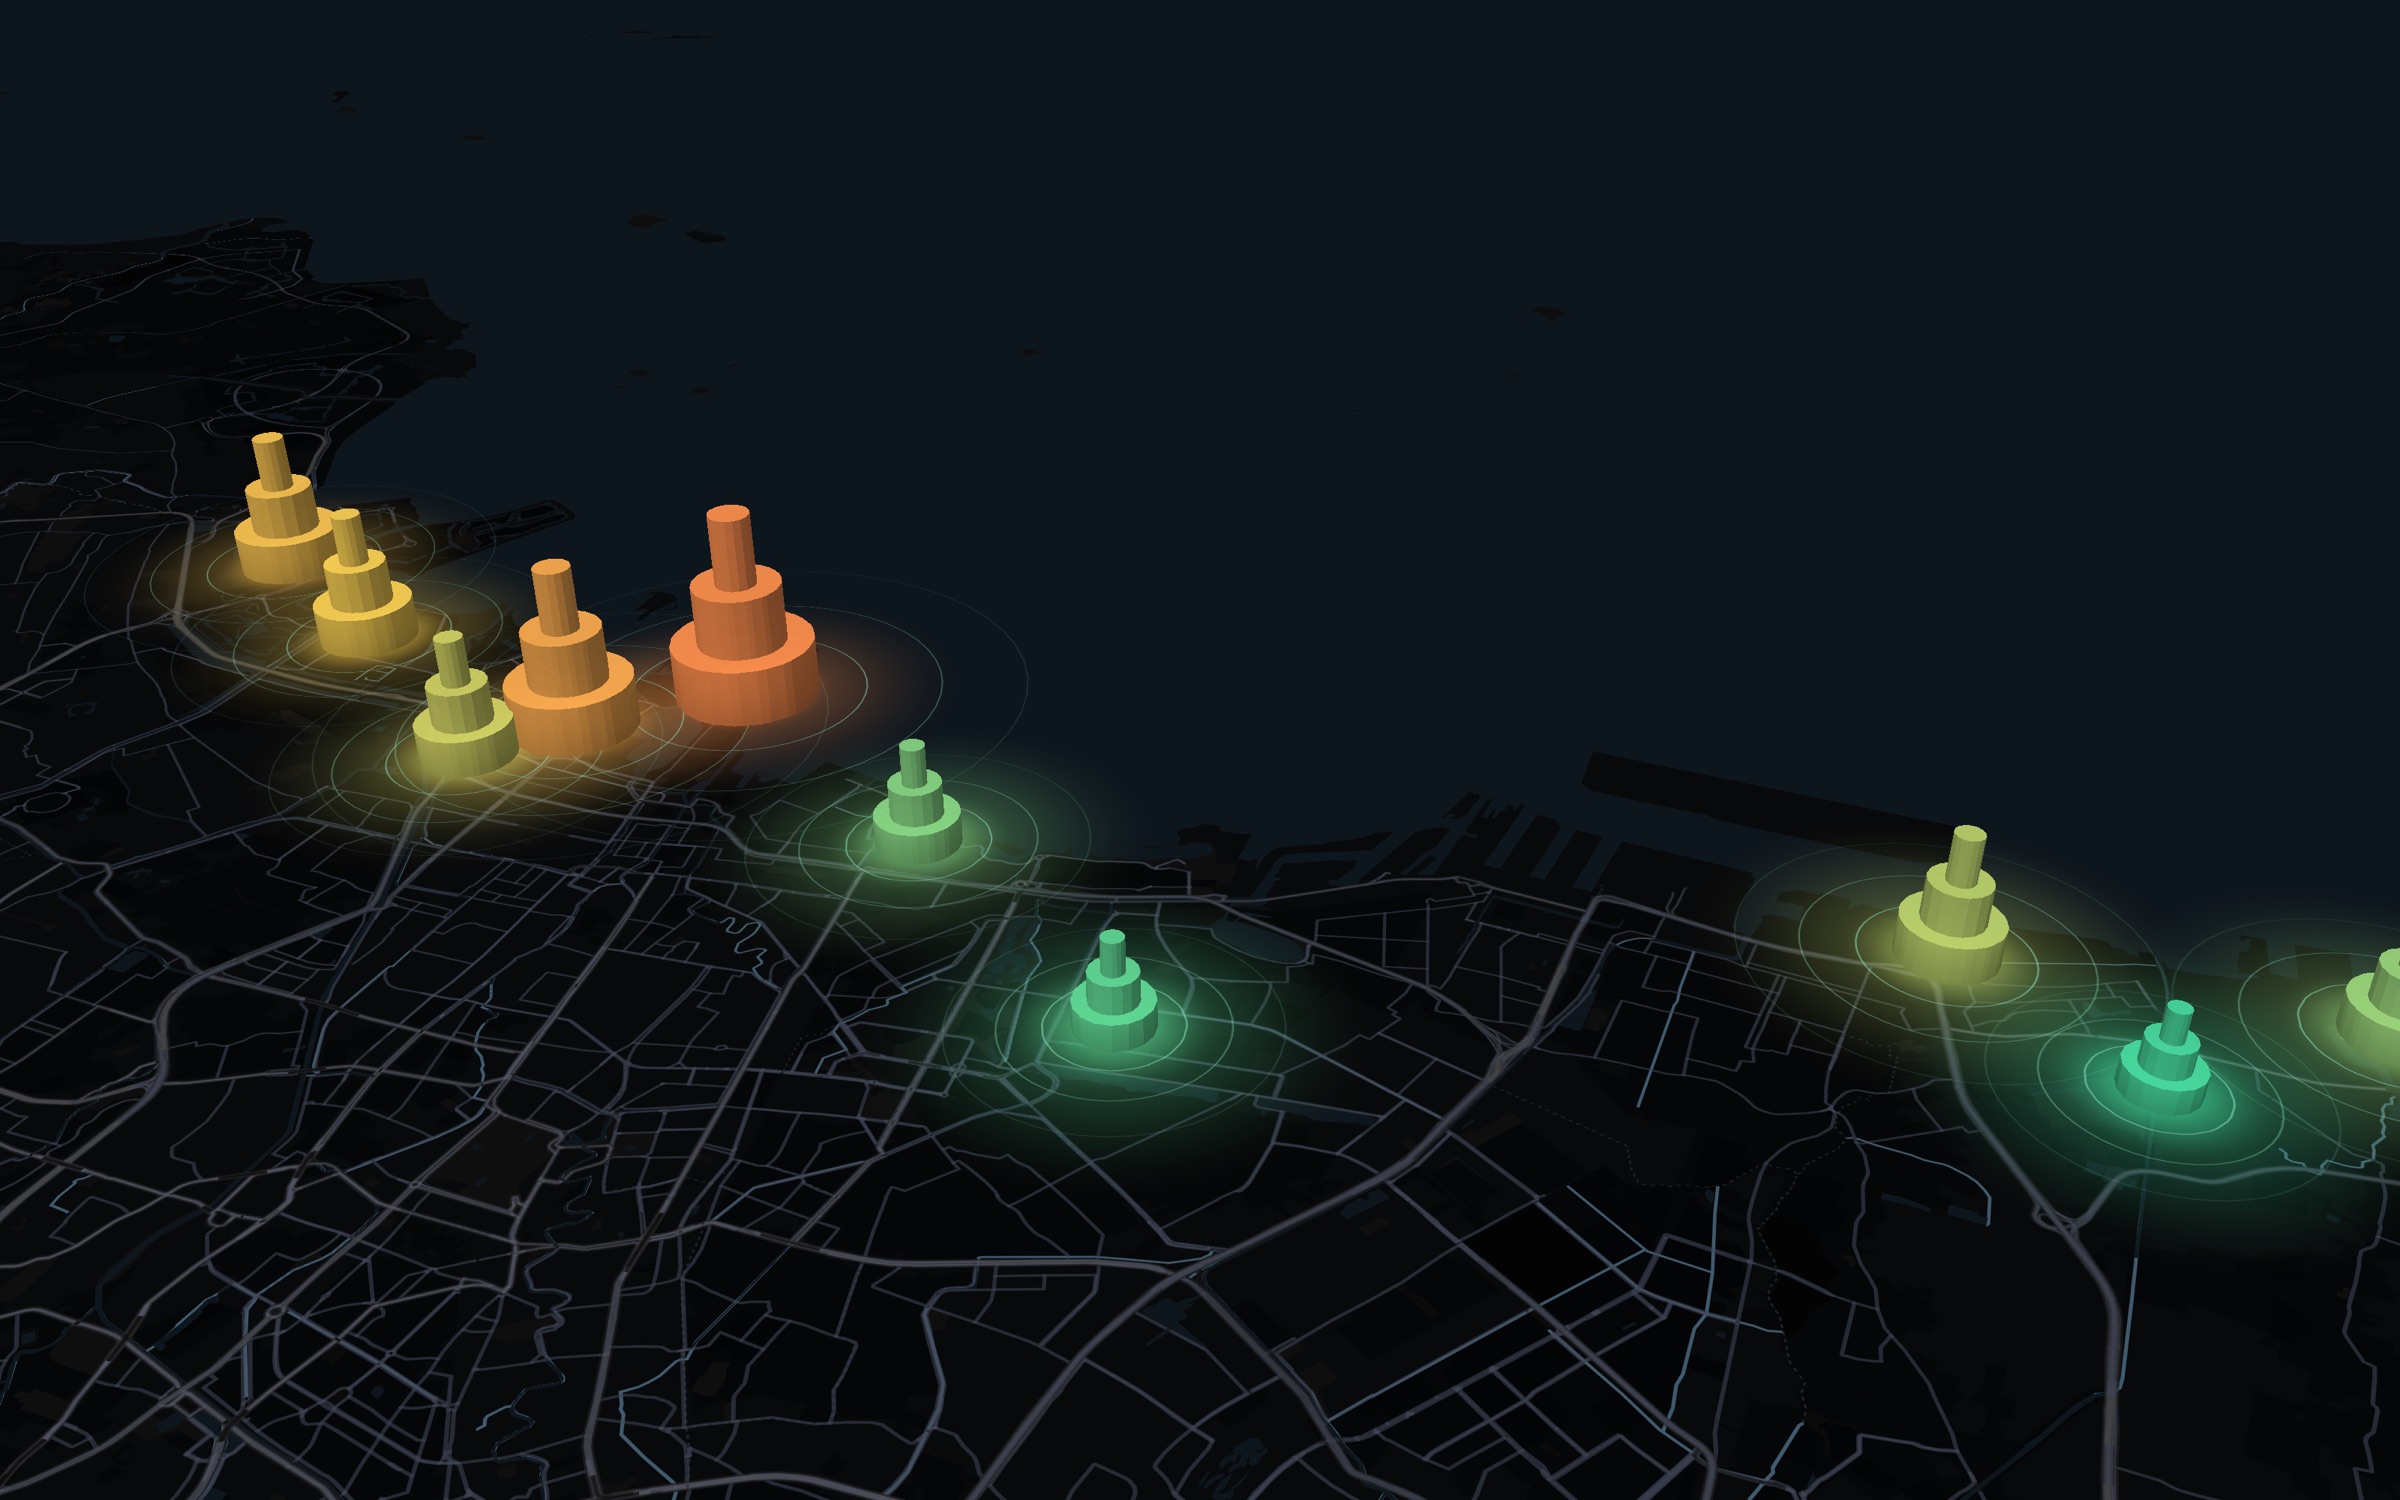
The ground sinks. The pumps stay hidden.
North Jakarta drops several centimeters a year. Some bowls drop more than 10.
- Water left under the pump
- 55%
- Ground over the pump
- −8 cm a year
01. Cause
Deep pumps empty the aquifer
The ground above a heavy pump settles into a bowl. Deep groundwater pumping is the main cause.
02. Gap
The ban is hard to enforce
Pumping is banned in large zones (Pergub 93/2021). Piped water reaches about 82% of the city, so some people still pump their own.
03. Blind spot
No city-wide view
Regulators cannot see where the ground still sinks, which bowls point to pumping, or when the sea reaches a street.
Few inspectors. Many bowls. Where should they go first?
One radar view answers six different questions.
A satellite measures how far the ground moves, down to a few millimeters. Each water team reads that same measurement for a different decision.
Dinas SDA and Badan Geologi
Where is water still pumped without a permit?
Jakarta's water agency (Dinas SDA) and the national permit agency (Badan Geologi) get a ranked list of the fastest-sinking places, so inspectors know where to go first.
- Radar scan
- Ranked places
- Site visit
A ranked place is a reason to visit, not proof of a pump.
KemenLH and Dinas SDA
Where would putting water back help most?
Orbitalis lists fast-sinking areas where the soil can take recharge (rain that soaks in) or injection (water pumped down into the aquifer, the layer that holds groundwater).
- Sinking rate
- Soil check
- Field survey
A screening only. A field survey approves each site.
PAM Jaya
Where should the next water pipes go?
Orbitalis counts the people in each area who have no pipe and pump their own water, so the city water utility lays pipes where they replace the most groundwater.
- People without pipes
- Water gap
- Pipe plan
PAM Jaya aims to reach every home by 2029.
KemenLH and regional environment offices
Are people giving water back to the ground?
The draft water farming rule asks groundwater users to give water back with tanks, biopores (small holes that let rain soak in), or ponds. Satellite images check each site.
- Register site
- Satellite check
- Sinking slows
Success means the sinking slows, not that the ground rises.
Developers
What is the ground like under my parcel?
Draw a parcel and read how fast it sinks, how deep it may sink by 2050, and which groundwater rules apply.
- Draw parcel
- Read report
- Share link
A first screening, not a soil survey or legal advice.
Anyone who buys or sells a home
How fast does the ground sink near me?
Type an address and read, in plain words, how fast the area sinks.
- Type address
- Area cell
- Plain words
The result covers about 500 meters, never one building.
Follow one bowl from radar to visit.
This is the regulator flow on the desk. Each step uses the same site, Bowl 04.
 ORBITALISOverviewBowlsMap
A map of North Jakarta with ground-motion bowls. Bowl 04 is marked.
Example data. Real numbers load from NISAR jobs.
The five people on the work.
Five people build ORBITALIS together.
Three ways to start.
Most people open the map as a guest first. Guests can also try the desk. Regulators sign in for schedules and outcomes.
Guest map
See Jakarta sink without your own account. Ground motion, bowls, and the sea plane.
One click as a guest
Try as guest
Start hereOpen the desk with a guest session. Rank bowls, open evidence, and walk the visit flow.
See the 12-day passGuest, full desk
Sign in
Regulator accounts keep schedules and outcomes across visits.
Email, password
Sign in
The 12-day NISAR pass.
One revisit cycle. Fresh pairs land, bowls update, and the desk shows what changed.
Week 1
- Day 1Pass window opens over Jakarta.
- Day 2Raw radar arrives at the archive.
- Day 3Interferogram pair is ready to browse.
- Day 4Bowl rates update on the desk.
- Day 5Ranks move. Inspectors see the change.
- Day 6Weekend
- Day 7Weekend
Week 2
- Day 8Next pass is on the calendar.
- Day 9Compare the new pair to the last one.
- Day 10Flag bowls that did not slow after the ban.
- Day 11Schedule visits from the worst leads.
- Day 12Record outcomes before the next pass.
- Day 13Weekend
- Day 14Weekend
Review the catalog on pass days. Act on rank changes after the new pair lands.
People stay unnamed.
A bowl is a place to inspect. It is not proof of a pump, and it never names a person.
No personal names
Leads point to areas and rates, not to owners or households.
Lead, not proof
An inspection still has to confirm whether a pump is there.
Open radar sources
NISAR and Sentinel-1 come through public archives you can cite.
Clear synthetic labels
When numbers are synthetic, the desk says so until real jobs load.
Sources on the desk
- NISAR
- Sentinel-1
- ASF DAAC
- OpenStreetMap
- CORS
- DKI zones
Questions.
Short answers to what people ask first.
Ready to read the coast?
Open the map or the desk as a guest. Sign in when you need schedules and outcomes.